Dashboard BETA
The Ariadne Dashboard is a self-contained web interface for browsing, searching, and managing your memory system. It runs as a single FastAPI process with zero additional infrastructure.
Beta status. The dashboard is functional but evolving. APIs and UI may change between minor versions.
Starting the dashboard
# Install dashboard dependencies
pip install "ariadne-memory[dashboard]"

# Launch with default settings
ariadne dashboard

# Custom host and port
ariadne dashboard --host 0.0.0.0 --port 8765

# Point at a specific database
ariadne --db-path /path/to/memory.db dashboardOpen http://localhost:8765 in your browser. The dashboard auto-detects the local server — no API key or configuration needed.
Via Python
from arriadne.dashboard.server import create_app
import uvicorn

app = create_app(db_path="arriadne.db")
uvicorn.run(app, host="127.0.0.1", port=8765)Command-line flags
| Flag | Default | Description |
|---|---|---|
--port | 8765 | Port to listen on |
--host | 127.0.0.1 | Bind address. Use 0.0.0.0 to expose on all interfaces |
--no-browser | off | Suppress auto-opening the browser on launch |
Pages
Dashboard (home)
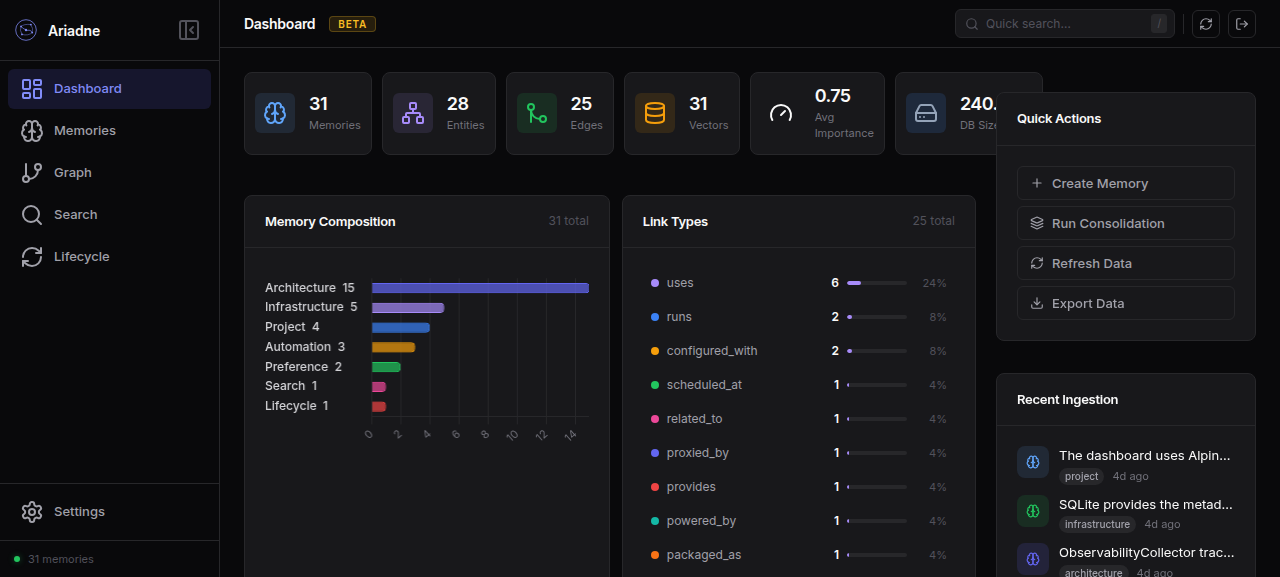
The landing page gives you a system overview at a glance:
System metrics
Six stat cards across the top show the current state of your memory system:
| Metric | Description |
|---|---|
| Memories | Total active memories in the database |
| Entities | Unique named entities extracted from memories |
| Edges | Relationships (links) between entities |
| Vectors | FAISS vector index size |
| Avg Importance | Mean importance score across all memories (0–1) |
| DB Size | On-disk database size |
Memory Composition
A horizontal bar chart showing memory distribution by type (architecture, infrastructure, project, etc.). Bars are sorted descending — hover for exact counts and percentages.
Link Types
A compact ranked list of relationship types between entities, sorted by frequency. Each row shows a colored indicator, type name, count, proportional bar, and percentage. Long lists collapse to the top 10 with an expand button.
Activity Timeline
A bar chart of memory creation activity over the selected time range (1D / 7D / 30D / 90D).
Quick Actions
| Action | Description |
|---|---|
| Create Memory | Opens a form to add a new memory with content, type, and importance |
| Run Consolidation | Triggers memory consolidation (merge duplicates, strengthen ties) |
| Refresh Data | Reloads all dashboard data from the database |
| Export Data | Downloads all memories, entities, and edges as a JSON file |
Recent Ingestion
Shows the most recently created memories with their type badge, truncated content preview, and relative timestamp.
Memories
Browse all memories in a searchable, filterable grid. Click any memory card to view its full content, metadata, entities, and lifecycle status.
Graph
An interactive force-directed knowledge graph.
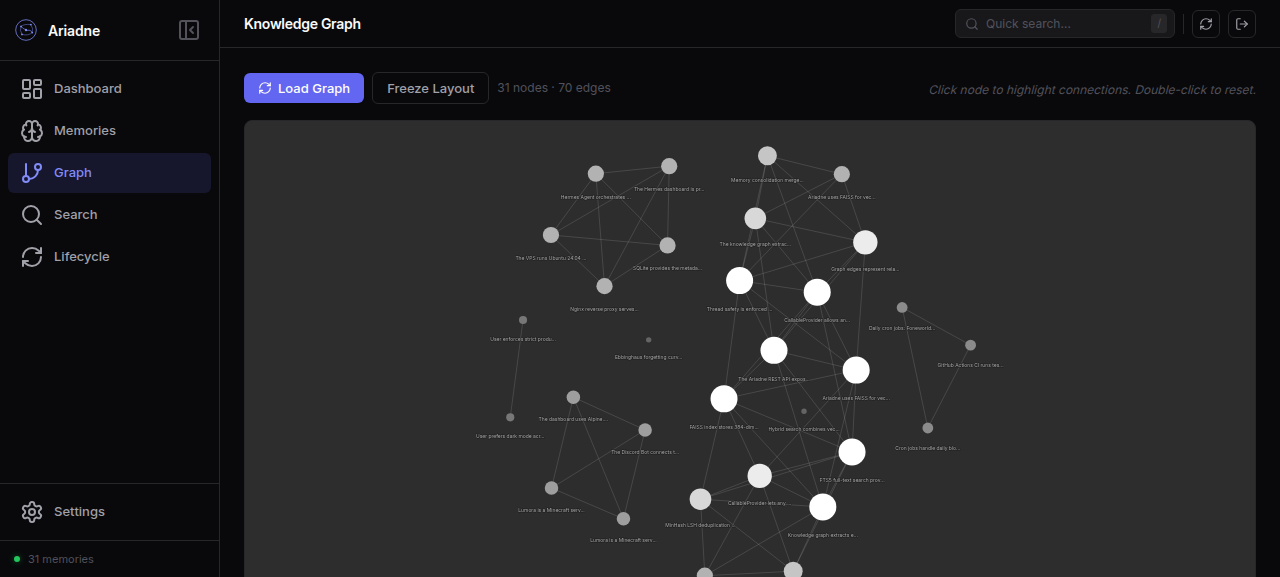
- 31 nodes (memories) connected by 70 edges (shared entities)
- Nodes are labeled with truncated content text
- Drag nodes to rearrange the layout
- Scroll to zoom in/out
- Click a node → enters Focus Mode, showing its neighborhood at a configurable depth (1–5). The neighborhood view highlights the selected node and its direct connections.
- Click "Exit Focus" to return to the full graph
- "Freeze Layout" button stops the physics simulation to pin nodes in place
Search
Full-text and semantic search against memories.
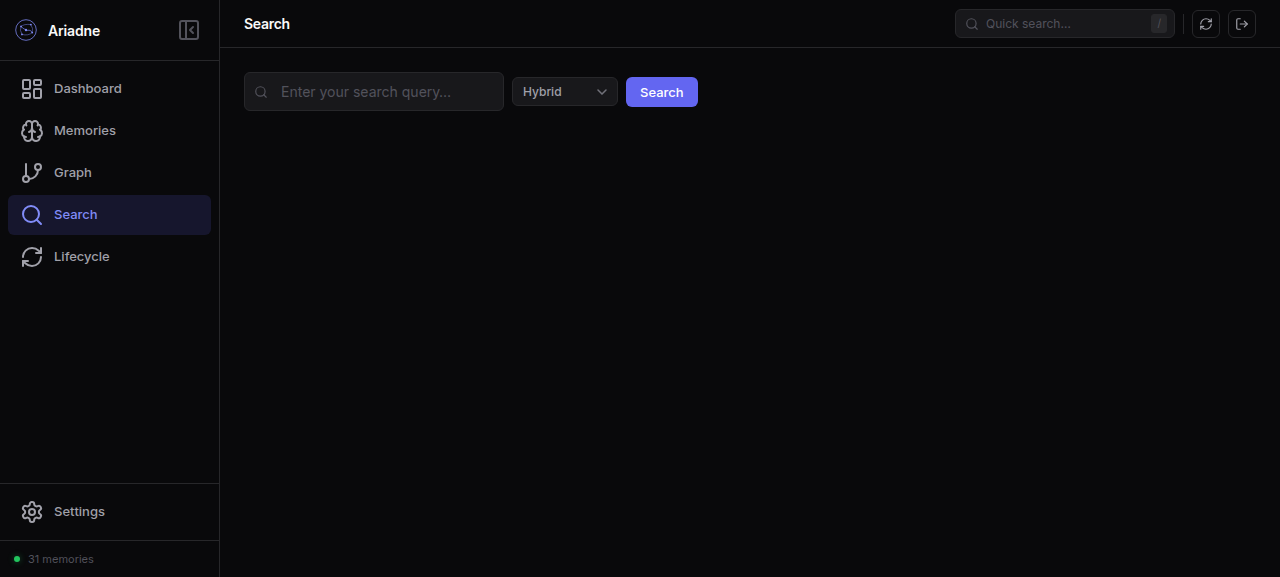
| Mode | Description |
|---|---|
| Hybrid (default) | FAISS vector similarity + FTS5 keyword search fused with Reciprocal Rank Fusion |
| Vector only | Pure cosine similarity via FAISS |
| Text only | Pure FTS5 BM25 keyword search |
Type a query and click Search. Results appear below with relevance scores, memory type badges, and matched content snippets.
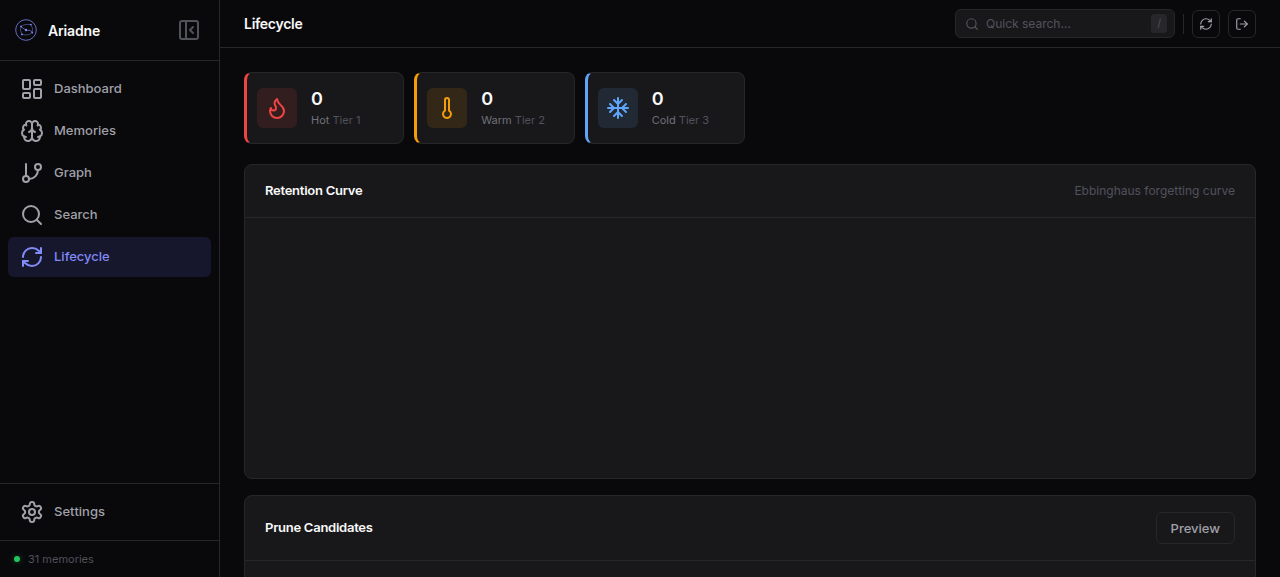
Lifecycle
Monitor the cognitive retention model — which memories are hot, warm, or cold.
| Tier | Icon | Description |
|---|---|---|
| Hot (Tier 1) | Fire | Frequently accessed, high retention strength |
| Warm (Tier 2) | Thermometer | Moderately accessed, mid retention |
| Cold (Tier 3) | Snowflake | Rarely accessed, low retention |
- Retention Curve — projected strength decay over 30 days per tier (Ebbinghaus forgetting curve)
- Prune Candidates — click Preview to see memories eligible for eviction based on retention strength and age
Settings
Manage API keys for programmatic access to the Ariadne REST API.
REST API
The dashboard exposes a REST API at /api/… — the same endpoints the frontend calls. This lets you drive the dashboard programmatically or build custom integrations.
System stats
# Get full system statistics
curl http://localhost:8765/api/stats

# Get memory type breakdown
curl http://localhost:8765/api/composition

# Get entity relationship breakdown
curl http://localhost:8765/api/link-typesActivity
# Activity timeline for the last 7 days
curl "http://localhost:8765/api/activity?range=7d"

# Last 8 most recent memories
curl "http://localhost:8765/api/recent?limit=8"Health report
# System health: total memories, avg importance, oldest age, DB size, dedup stats
curl http://localhost:8765/api/health-reportResponse:
{
  "total_memories": 31,
  "avg_importance": 0.745,
  "oldest_memory_days": 4.2,
  "db_size_kb": 240.0,
  "dedup_index_size": 31,
  "dedup_hits": 0,
  "decay_candidates": 0,
  "status": "healthy"
}Graph
# Full memory graph (nodes + edges)
curl http://localhost:8765/api/graph/memory

# Neighborhood subgraph for a specific memory
curl "http://localhost:8765/api/graph/neighbors?memory_id=46&depth=2"CRUD
# Store a new memory
curl -X POST http://localhost:8765/api/remember \
  -H "Content-Type: application/json" \
  -d '{"content": "My new memory", "memory_type": "architecture", "importance": 0.8}'

# Search memories
curl "http://localhost:8765/api/search?q=my+memory&mode=hybrid"

# Get tags
curl http://localhost:8765/api/tagsExport / Import
# Full JSON export of all memories, entities, and edges
curl http://localhost:8765/api/export > backup.json

# Import from a previous export
curl -X POST http://localhost:8765/api/import \
  -H "Content-Type: application/json" \
--data-binary @backup.jsonMaintenance
# Via CLI
ariadne maintain

# Or trigger from the dashboard Quick Actions panelTroubleshooting
Dashboard won't start. Make sure you have the dashboard extra installed:
pip install "ariadne-memory[dashboard]"Pages are blank / charts don't render. The dashboard requires a modern browser (Chrome, Firefox, Safari). Check the browser console (F12) for JavaScript errors.
"No such table" errors. Your database may be from an older version. Run ariadne migrate to apply pending schema migrations.
Dashboard won't start on a VPS. Use --host 0.0.0.0 to bind on all interfaces, then access it via your server's IP:
ariadne dashboard --host 0.0.0.0 --port 8765